Miah's Two-Phase Bar Chart Description Builder
You should spend about 20 minutes on this task.
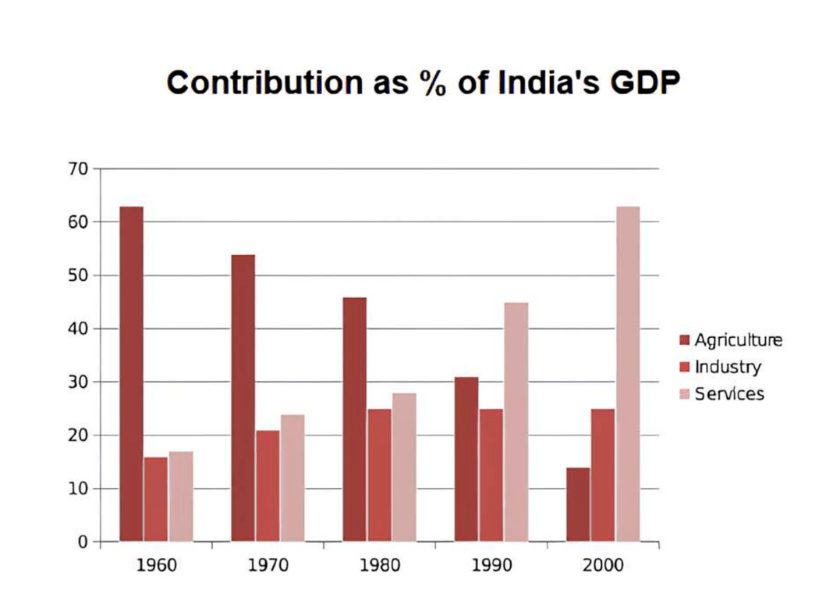
The bar chart below shows the sector contributions to India's gross domestic product from 1960 to 2000.
Summarise the information by selecting and reporting the main features, and make comparisons where relevant.
Write at least 150 words.
👤 Student Information
✏️ Phase 1: Data Language & Trends
📝 Word Bank - Data Description Language:
Introduction
Overview
Body Paragraph 1 (Early Period: 1960-1980)
Body Paragraph 2 (Later Period: 1990-2000)
✍️ Phase 2: Content Framework
Introduction
Example: "The bar chart illustrates how three economic sectors contributed to India's GDP across five different years between 1960 and 2000."
Overview
Example: "Overall, there was a significant shift in India's economic structure, with agriculture declining sharply and services growing substantially to become the dominant sector. Industry showed more fluctuating patterns."
Body Paragraph 1 - Agriculture Sector
Example: "In 1960, agriculture was the largest contributor, accounting for 62% of India's GDP. However, this figure declined steadily over the period, dropping to 54% in 1970, 45% in 1980, 32% in 1990, and reaching a low of just 24% by 2000, representing a fall of 38 percentage points."
Body Paragraph 2 - Services & Industry Sectors
Example: "In contrast, the services sector experienced dramatic growth. Starting at only 20% in 1960, it increased progressively to 26% (1970), 31% (1980), and 40% (1990), before reaching 62% by 2000, becoming the largest contributor to GDP."
Example: "Meanwhile, industry showed a more fluctuating pattern. It rose from 18% in 1960 to a peak of 28% in 1990, but then declined to 14% by 2000, ending the period at a lower level than it had begun."
Conclusion (Optional for Task 1)
Example: "These changes reflect India's transition from an agriculture-based economy to a more service-oriented economic structure over the 40-year period."